यह भी देखें

 16.06.2026 07:06 PM
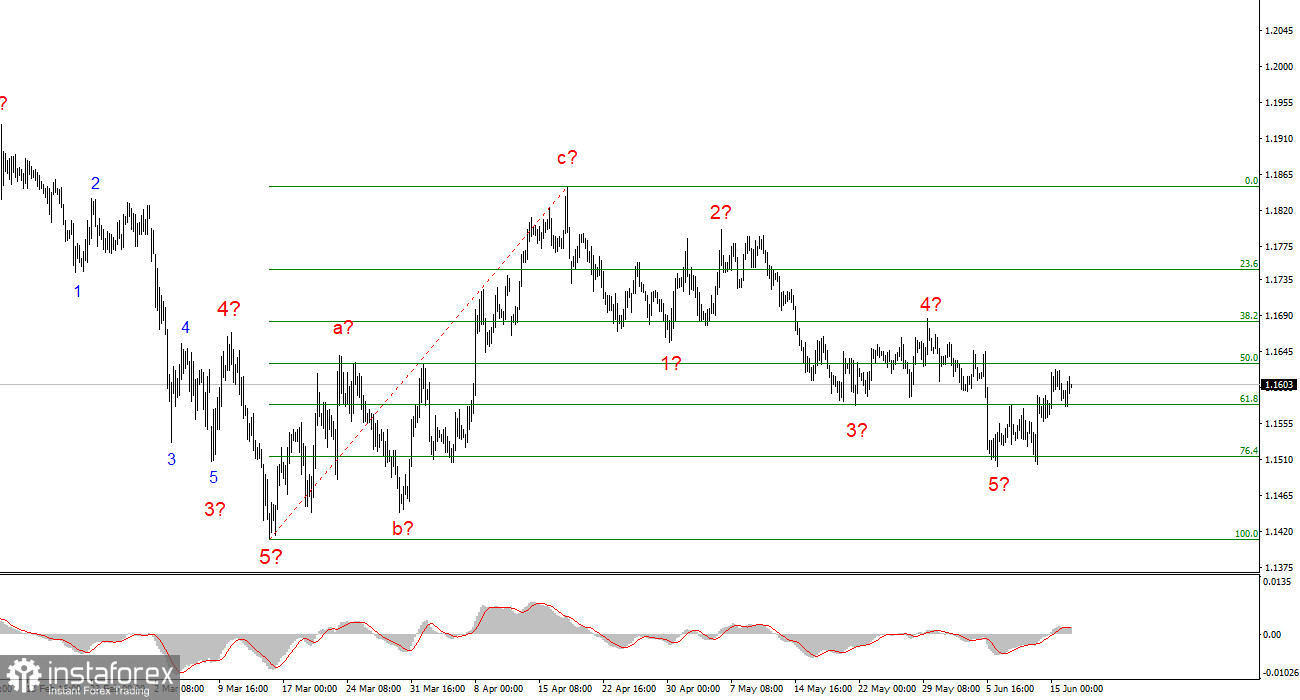
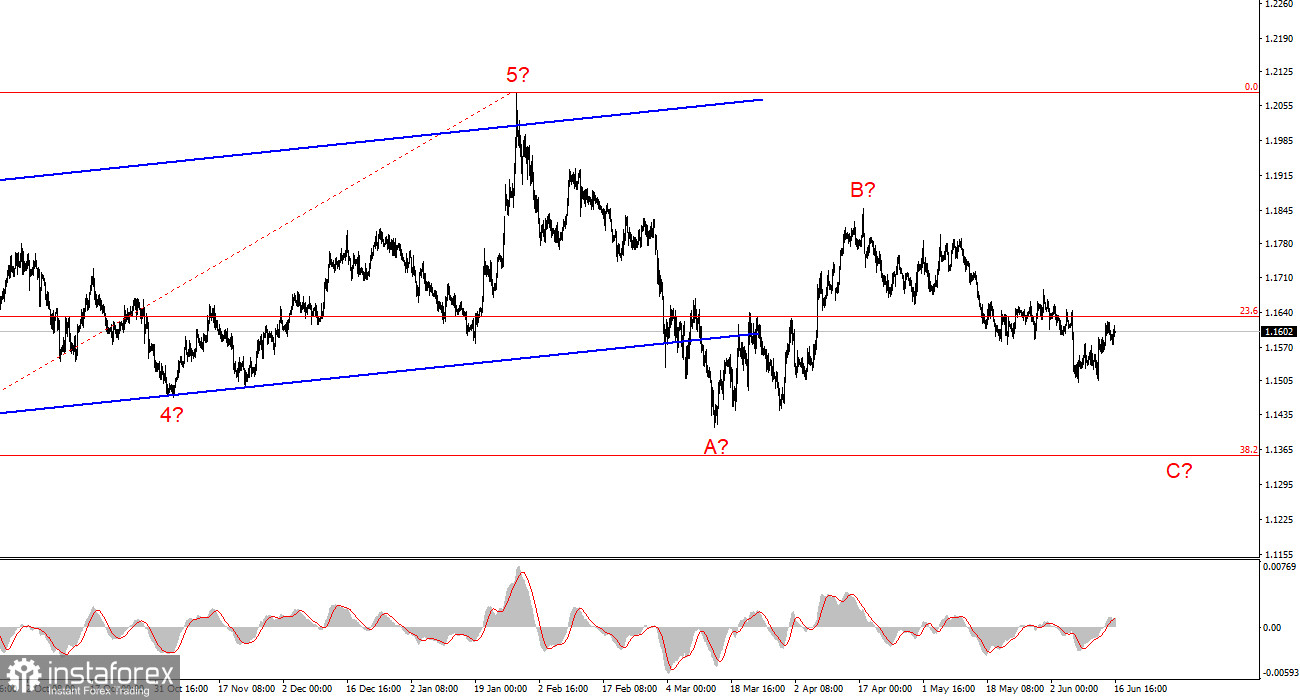
The wave pattern on the 4-hour chart of EUR/USD has become fairly clear. There is still no indication that the upward trend segment (shown in the lower chart), which began in January of last year, has been canceled. However, the trend structure has now taken on a corrective form. From a longer-term perspective, the formation of wave C can be expected, with its low likely to fall below the low of wave A. At the moment, it is difficult to believe in such a significant decline in the euro, as the conflict in the Middle East appears to be moving toward a resolution and the U.S. dollar currently lacks other major sources of support. Therefore, the anticipated wave C could prove to be truncated.
On the lower time frame, I can identify a classic five-wave bearish structure. Following the completion of this structure, the instrument may transition into a new upward wave sequence, and at present, the structure appears complete. Consequently, a rise in the euro can be expected from the 1.1513 level, which corresponds to the 76.4% Fibonacci retracement level. However, without support from geopolitical developments, the euro cannot expect strong market demand.
The EUR/USD pair gained 10 basis points during Tuesday's session, while volatility remained extremely low from the morning onward. The market remains calm and is not rushing to price in new developments. Today, traders ignored another four economic reports from the European Union and the United States, but this should surprise no one. We have been observing this pattern for several months. Ahead of the meetings of two major central banks, the market is also showing no signs of anxiety. Neither the Federal Reserve nor the Bank of England is expected to raise interest rates in June, which is one reason for the market's calm behavior. As for the ceremonial signing of the agreement between Iran and the United States scheduled for Friday, there is currently far more symbolism surrounding the event than practical significance.
Earlier this morning, I noted that both the CIA and the U.S. Department of Defense remain skeptical that Iran is prepared to abandon its nuclear weapons ambitions and uranium enrichment activities in the future. This is precisely where the doubts of market participants originate—from retail traders and commercial banks to the parties involved in the negotiations themselves. Iran has fiercely defended its right to possess nuclear weapons—or at least nuclear fuel—for fifty years. Is it really prepared to give up that position now? Furthermore, as has become increasingly clear, Iran was not the initiator of military aggression, is not afraid of war, and has no intention of surrendering. What, then, could compel Iran to abandon its nuclear program if it is not even deterred by the prospect of war and has effectively lived under military pressure for decades? Therefore, the probability of reaching a comprehensive nuclear agreement remains low. Donald Trump has already stated that if Tehran rejects a nuclear agreement, he is prepared to resume military operations in the Middle East. As a result, many market participants view the agreement scheduled for Friday with a considerable degree of skepticism.
Based on my EUR/USD analysis, I conclude that the instrument remains within a broader upward trend segment (shown in the lower chart), while in the shorter term it remains within a downward trend segment that may already be complete. In my view, this is a reasonably favorable time to consider forming long positions. The unsuccessful attempt to break below the 1.1513 level, corresponding to the 76.4% Fibonacci retracement level, combined with the completed appearance of the downward trend segment, suggests that the pair may transition into a new upward wave sequence with targets located around the 1.17 level and above.
On the higher time frame, an upward trend segment remains visible, followed by the development of a corrective wave structure. In the near future, wave C is expected to form, with targets near 1.1352, which corresponds to the 38.2% Fibonacci retracement level. Once the A-B-C corrective structure is completed, a new long-term upward trend may begin.
Key Principles of My Analysis:

