یہ بھی دیکھیں

 07.05.2026 08:27 AM
NASDAQ 100
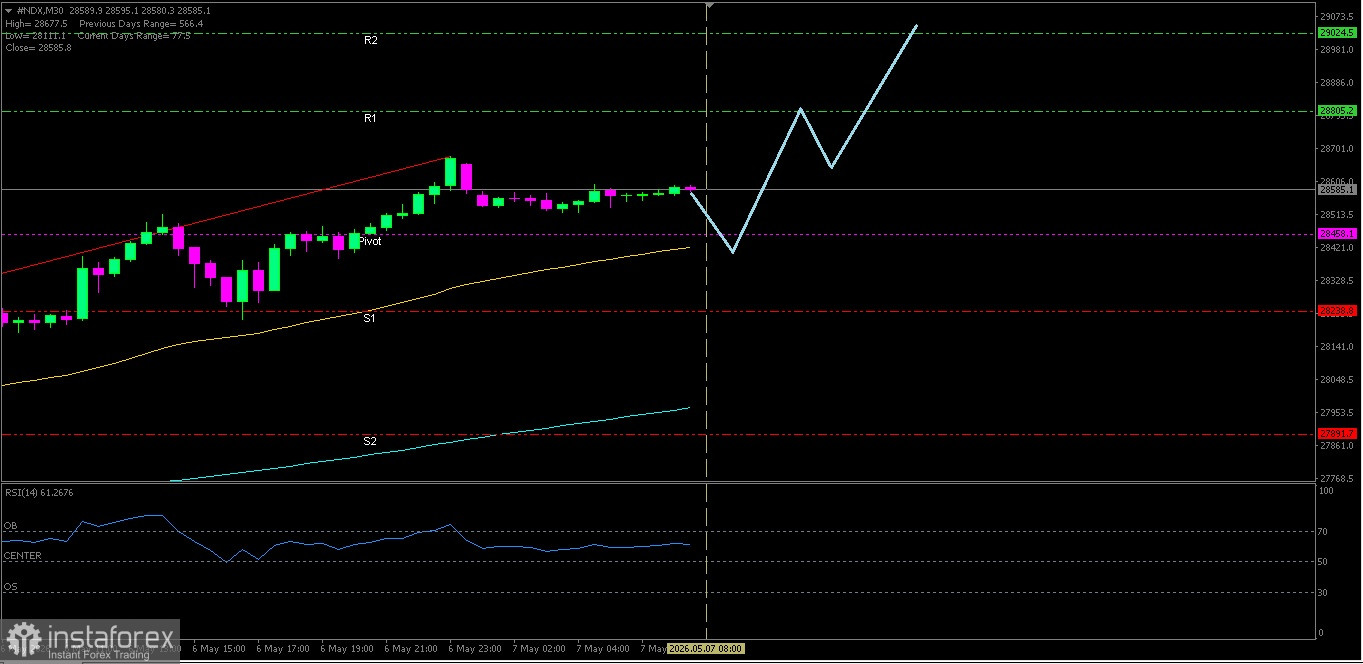
With RSI(14) in the Neutral-Bullish level and both EMAs forming a Golden Cross intersection, then #NDX has the potential to test its nearest resistance level.
Key Levels
1. Resistance. 2 : 29024.5
2. Resistance. 1 : 28805.2
3. Pivot : 28458.1
4. Support. 1 : 28238.8
5. Support. 2 : 27891.7
Tactical Scenario
Positive Reaction Zone: If the price holds at 28458.1, there is a likelihood of a rise toward 28805.2.
Momentum Extension Bias: If 28805.2 is broken, #NDX may move toward 29024.5.
Invalidation Level / Bias Revision
The upside bias weakens if #NDX breaks down below 27891.7.
Technical Summary
EMA(50) : 28415.4
EMA(200): 27961.2
RSI(14) : 62.22
Economic News Release Agenda:
From the United States the following economic data will be released:
US - Challenger Job Cuts y/y - 18:30 WIB
US - Unemployment Claims - 19:30 WIB
US - Prelim Nonfarm Productivity q/q - 19:30 WIB
US - Prelim Unit Labor Costs q/q - 19:30 WIB
US - Construction Spending m/m - 21:00 WIB
US - Natural Gas Storage - 21:30 WIB
US - Consumer Credit m/m - 02:00 WIB
You have already liked this post today
*تعینات کیا مراد ہے مارکیٹ کے تجزیات یہاں ارسال کیے جاتے ہیں جس کا مقصد آپ کی بیداری بڑھانا ہے، لیکن تجارت کرنے کے لئے ہدایات دینا نہیں.


