یہ بھی دیکھیں

 02.02.2026 12:14 PM
EUR/USD
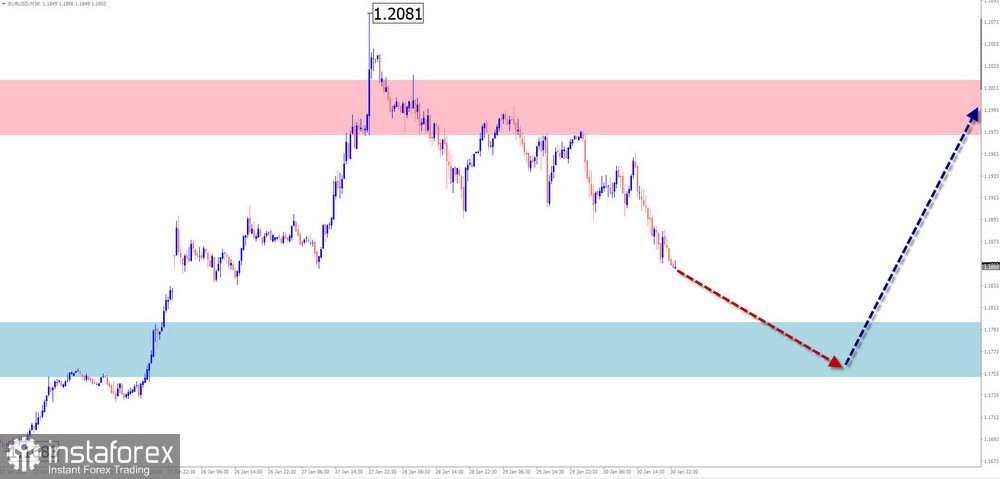
The direction of price movement of the major euro pair since February of last year has been defined by an upward wave algorithm. Within the wave structure, a counter-movement with reversal potential has been developing since early January. Its structure is close to completion. The support zone runs along the upper boundary of a large-scale potential reversal resistance zone.
In the first half of the coming week, a continuation of the decline is likely, with possible price pressure on the support zone. In this area, a pause and the formation of a reversal can be expected. A resumption of price growth is anticipated toward the end of the week.
Resistance:
Support:
Buy: Will become possible after confirmed reversal signals appear near the support area.Sell: Have limited potential; trading volume should be reduced.
USD/JPY
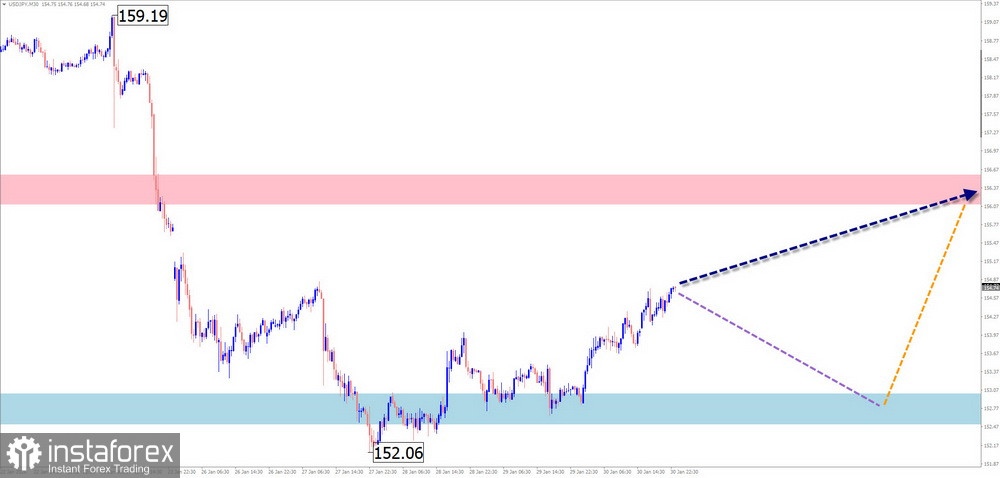
The current bullish wave of the main Japanese yen pair dates back to April of last year. Analysis of the structure shows that the counter-correction that began in November has all the signs of completion. Over the past week, the pair formed an upward segment with reversal potential.
Over the next couple of days, an overall sideways price movement can be expected. A short-term pullback is possible, but not beyond the calculated support zone. The second half of the week may be more volatile. A resumption of upward price movement should be anticipated. The calculated zones limit the weekly trading range of the pair.
Resistance:
Support:
Buy: Possible with reduced position size after confirmed reversal signals appear.Sell: Risky and may lead to deposit losses.
GBP/JPY
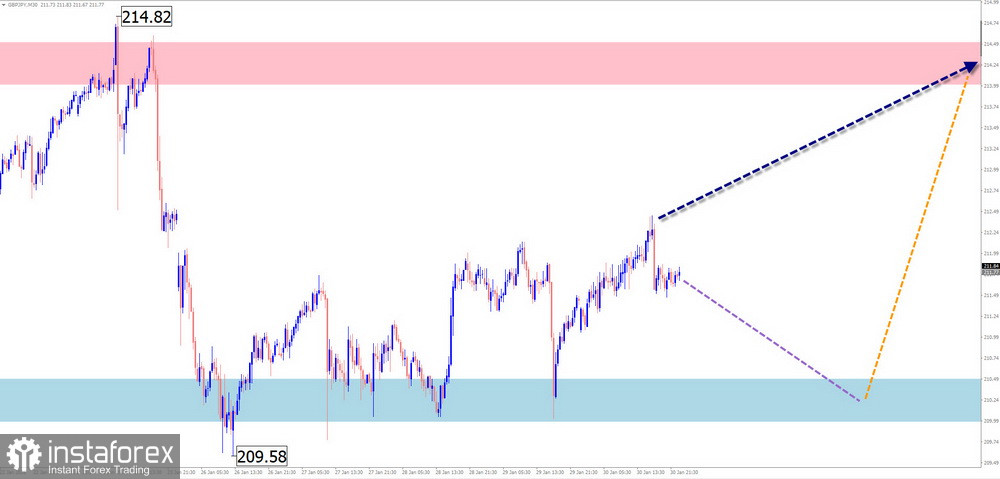
On the chart of the Japanese yen versus British pound pair, the most interesting trading opportunity is the last upward wave that started on April 9 of last year and remains unfinished. Within the wave structure, an upward segment with reversal potential began on January 26. If confirmed, the final part (C) will start.
In the coming week, the most likely scenario is continued sideways movement of the pair. In the first days, a downward move toward the support area is possible. A resumption of price growth can be expected closer to the weekend.
Resistance:
Support:
Sell: Possible intraday with fractional position sizes.Buy: Will become a priority after appropriate reversal signals appear in the support zone.
USD/CAD
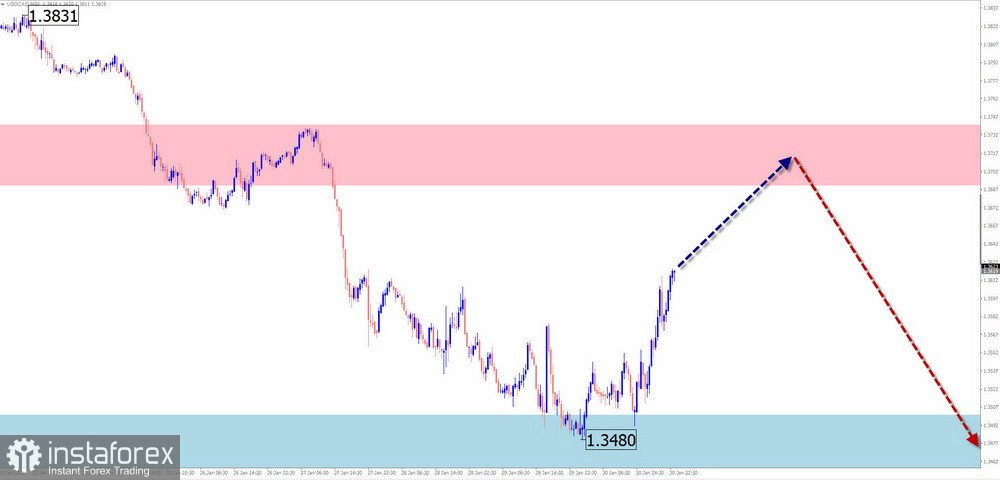
In the short term, the trend direction of the Canadian dollar major pair has been defined by a downward wave algorithm since early November of last year. Quotes have reached the boundaries of a wide, large-timeframe potential reversal zone. Throughout last week, the price formed an irregular correction in the form of a shifting flat. This segment of movement is entering its final phase.
At the beginning of the coming week, a continuation of the upward movement vector can be expected. The upper boundary of an intermediate resistance zone lies near the calculated resistance area. After that, there is a high probability of a pause, reversal formation, and the start of a price decline.
Resistance:
Support:
Buy: Possible with reduced position size intraday.Sell: Will become possible with fractional position size after confirmed signals appear near the resistance zone.
NZD/USD
On the chart of the main New Zealand dollar pair, the unfinished wave structure has an upward direction and dates back to April of last year. The final part of the wave (C) started in November. At the time of analysis, the wave does not appear complete. Quotes are pulling back downward from the lower boundary of a potential reversal zone.
In the coming days, a downward trend can be expected. A reversal is then likely to form near the calculated support area. After that, a reversal and resumption of price growth can be anticipated. The greatest activity is expected closer to the weekend.
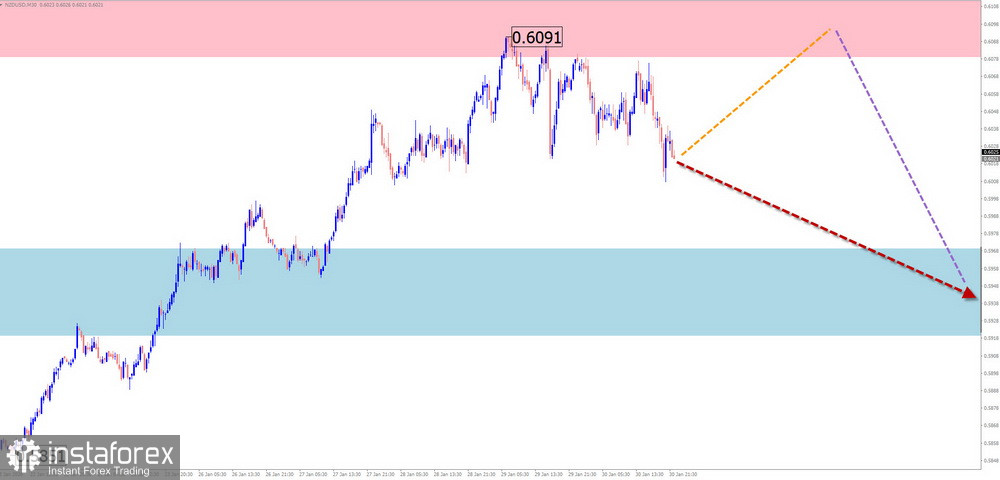
Resistance:
Support:
Sell: Have limited potential and are risky.Buy: Will become possible after confirmed signals from your trading system appear near the support area.
Bitcoin
The direction of Bitcoin's price fluctuations since July of last year has been defined by a downward wave algorithm. Since mid-November, a counter wave (B) has been developing. Quotes are moving sideways along the upper boundary of a large-scale potential reversal zone on the chart. At the time of analysis, the wave structure does not show completion.
At the beginning of the coming week, there is a high probability that the coin's price will pull back upward toward the calculated resistance boundaries. After that, quotes are expected to continue declining, potentially reaching the calculated support zone. After a reversal forms, price growth and a rise toward resistance levels can be expected.
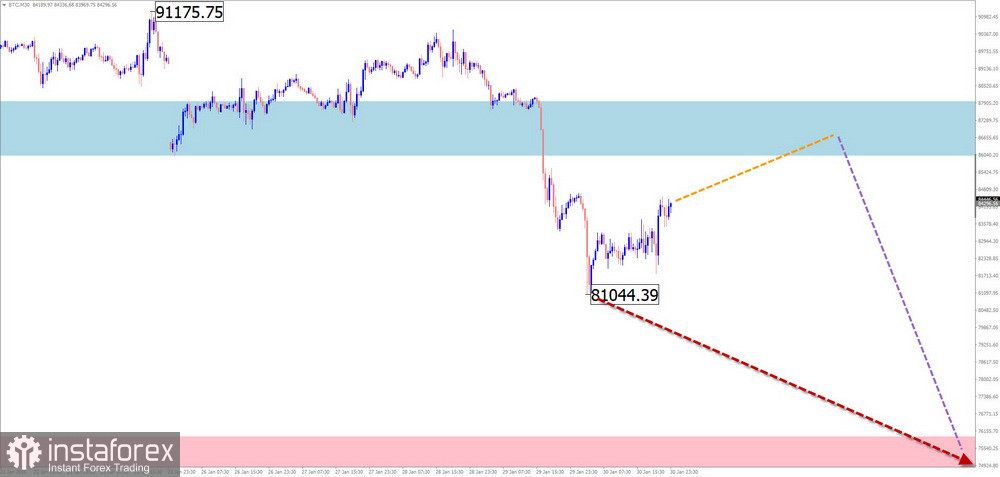
Resistance:
Support:
Sell: Possible with fractional position size during individual sessions; potential is limited.Buy: Will become relevant after confirmed reversal signals appear near the support zone.
Notes:
In simplified wave analysis (SWA), all waves consist of three parts (A-B-C). On each timeframe, the most recent unfinished wave is analyzed. Dotted lines indicate expected movements.
Attention: The wave algorithm does not take the duration of price movements over time into account.


