یہ بھی دیکھیں

 10.03.2026 06:41 AM
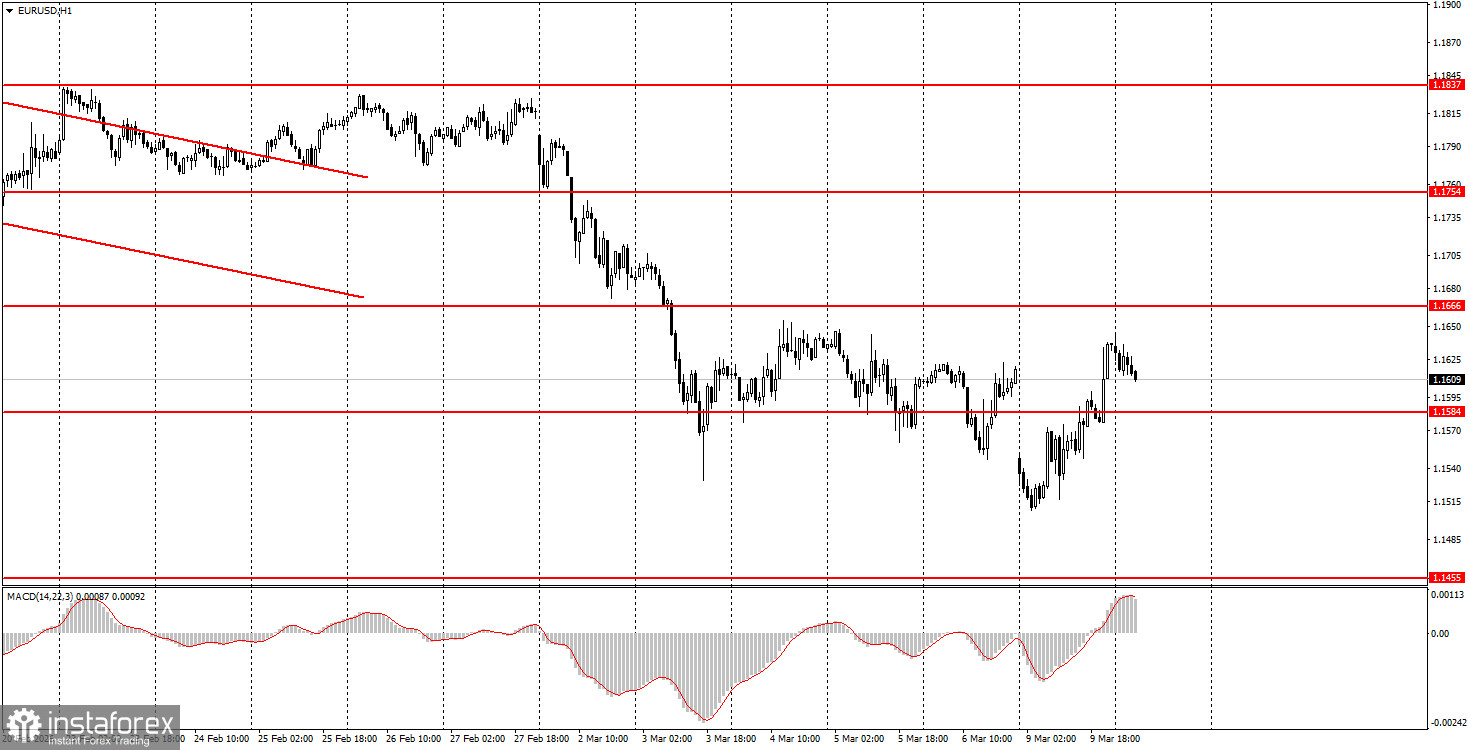
The EUR/USD currency pair showed a diverse movement pattern throughout Monday. The day began with another collapse, as Donald Trump indicated the possibility of a ground military operation in Iran, prompting the market to expect even worse developments and consequences than in the previous week. Oil prices soared to $120 per barrel; however, during the day, market tension eased somewhat. Oil fell to $90 per barrel, and by the end of the day, the U.S. dollar even depreciated slightly. Last night, Trump made several more controversial statements. First, to resolve the energy crisis, he lifted some sanctions on Russia. Second, he announced that the war in Iran would soon end and that the military operation's timeline would be accelerated by 4-5 weeks. It remains uncertain whether the markets believe Trump, but the situation has become less tense. In our view, the market has already fully priced in the conflict in the Middle East, so further dollar appreciation is only possible if oil prices, gas prices, or the situation in Iran worsen. However, the trend for the euro remains downward, which should not be forgotten.
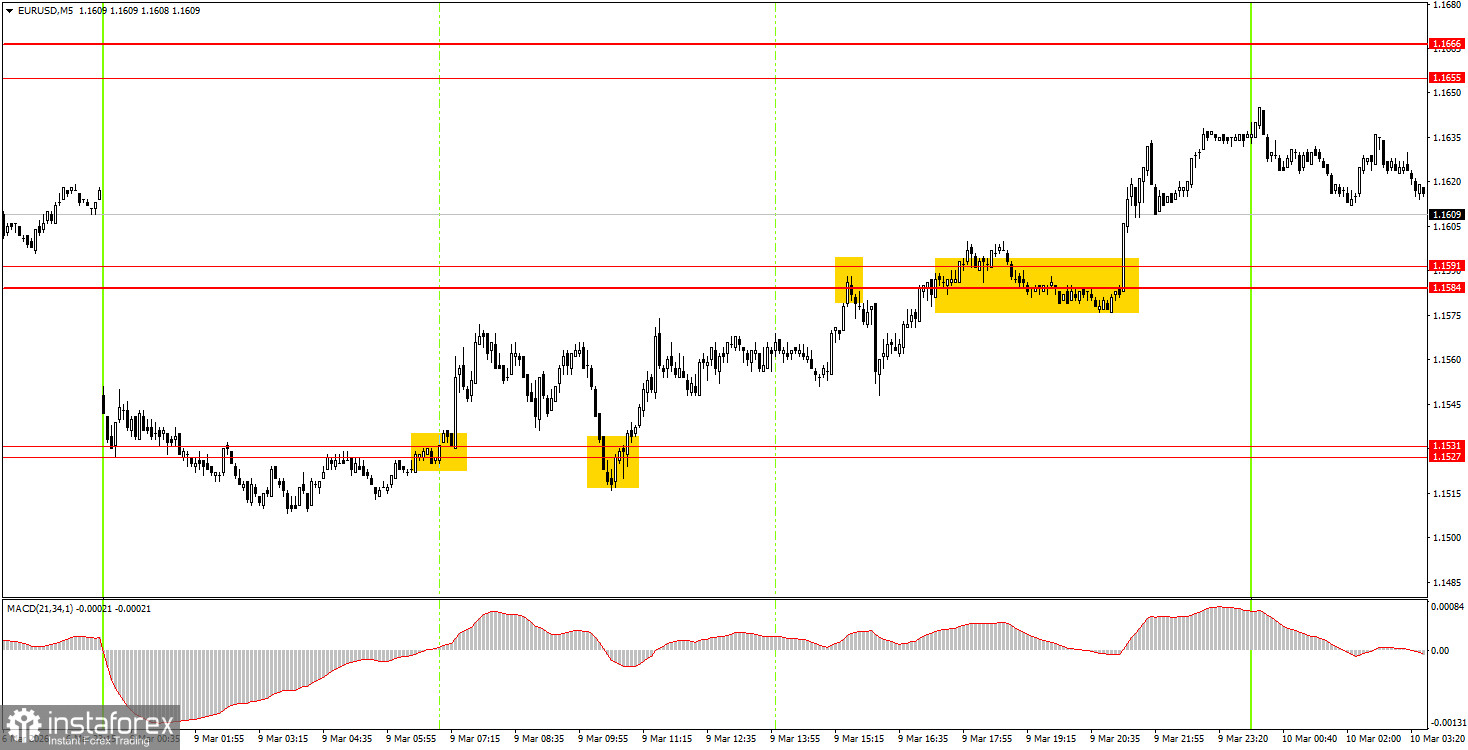
On the 5-minute timeframe, four trading signals were formed on Monday, and throughout the day, the pair predominantly rose. During the European trading session, two buy signals were generated in the 1.1527-1.1531 range, which could be executed with long positions. During the American session, the nearest target was reached—the area of 1.1584—where a bounce turned out to be a false sell signal (there could be no loss since the price moved down by 15 pips), and the breakthrough allowed traders to open another profitable trade.
On the hourly timeframe, the downward trend has resumed, but only "thanks" to the new escalation in the Middle East. At the beginning of 2026, a long-term upward trend resumed, so we expect a new medium-term rise in the euro. The overall fundamental background remains very challenging for the U.S. dollar, as confirmed by labor market, GDP, and unemployment reports. However, at this time, geopolitics remains the main focus for the market rather than economics.
On Tuesday, beginner traders may consider short positions if the price consolidates below the 1.1584-1.1591 range, targeting 1.1527-1.1531. A bounce from the area of 1.1584-1.1591 will allow for opening long positions with a target of 1.1655-1.1666.
On the 5-minute timeframe, important levels to watch include 1.1354-1.1363, 1.1413, 1.1455-1.1474, 1.1527-1.1531, 1.1584-1.1591, 1.1655-1.1666, 1.1745-1.1754, 1.1830-1.1837, and 1.1899-1.1908. On Tuesday, no important events are scheduled in either the U.S. or the Eurozone. The most significant report of the day in the Eurozone will be Germany's trade balance, while in the U.S., it will be the weekly ADP report and the existing home sales report.
Price levels of support and resistance are levels that serve as targets when opening buys or sells. Take Profit levels can be placed around them.
Red lines represent channels or trend lines that show the current trend and indicate the direction in which it is preferable to trade now.
The MACD indicator (14,22,3) – the histogram and the signal line – is a supporting indicator that can also be used as a source of signals.
Important speeches and reports (always included in the news calendar) can significantly affect the movement of the currency pair. Therefore, during their release, trading should be done with utmost caution, or traders should exit the market to avoid sharp price reversals against the previous movement.
Beginning traders in the forex market should remember that not every trade can be profitable. Developing a clear strategy and effective money management are the keys to long-term trading success.


