یہ بھی دیکھیں

 13.03.2026 08:21 PM
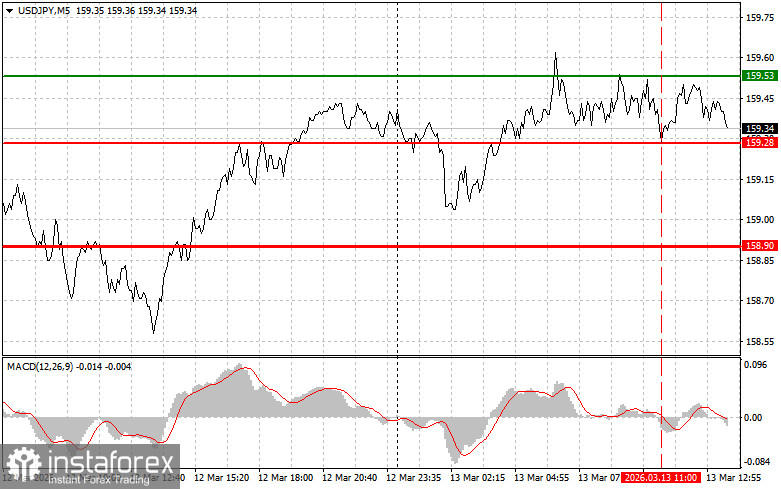
The test of the 159.28 price occurred when the MACD indicator had just begun moving downward from the zero line, which confirmed a correct entry point for selling the dollar. However, the pair did not proceed with a decline afterward.
If we look at the chart, there are also very few traders willing to buy above 159 yen, as many fear possible intervention by the Bank of Japan. It is quite possible that a surge in volatility may occur during the second half of the day.
Market participants will focus on the U.S. GDP data for the fourth quarter of 2025. If the actual figures exceed forecasts, this could become a powerful driver for the dollar's growth, confirming the strength of the U.S. economy. Equally important will be the release of data on the Personal Consumption Expenditures (PCE) price index. This indicator plays a key role in assessing inflationary pressure for the Federal Reserve.
However, no matter how soft the index may be, it is unlikely to affect the Federal Reserve's plans regarding interest-rate reductions, since market participants clearly understand that an energy shock caused by high oil and gas prices in the coming months is unlikely to be avoided.
The base trading scenario remains a sideways channel, with selling on updates of strong resistance in the 159.50–160.00 level. Weak U.S. data could lead to a sharp decline in USD/JPY toward the end of the week.
As for the intraday strategy, I will mainly rely on the implementation of Scenario No. 1 and Scenario No. 2.
Buy Signal
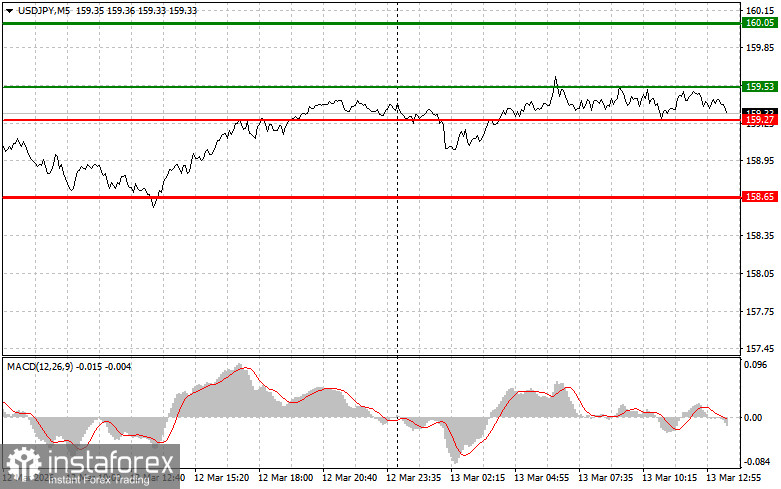
Scenario No. 1: Today I plan to buy USD/JPY when the price reaches the entry point around 159.53 (green line on the chart) with a target of 160.05 (thicker green line on the chart). Around 160.05, I will exit buy positions and open sell positions in the opposite direction (expecting a 30–35 point movement in the opposite direction from that level). Growth of the pair today can be expected after strong economic data.
Important: Before buying, make sure the MACD indicator is above the zero line and just beginning to rise from it.
Scenario No. 2: I also plan to buy USD/JPY today if there are two consecutive tests of the 159.27 price level while the MACD indicator is in the oversold zone. This will limit the pair's downward potential and lead to an upward market reversal. Growth toward the 159.53 and 160.05 levels can then be expected.
Sell Signal
Scenario No. 1: I plan to sell USD/JPY today after the price breaks the 159.27 level (red line on the chart), which could lead to a quick decline in the pair. The key target for sellers will be 158.65, where I will exit sell positions and immediately open buy positions in the opposite direction (expecting a 20–25 point movement in the opposite direction from that level). Pressure on the pair may return today if very weak economic data are released.
Important: Before selling, make sure the MACD indicator is below the zero line and just beginning its downward movement.
Scenario No. 2: I also plan to sell USD/JPY today if there are two consecutive tests of the 159.53 price level while the MACD indicator is in the overbought zone. This will limit the pair's upward potential and lead to a downward market reversal. A decline toward 159.27 and 158.65 can then be expected.
What the Chart Shows
Important: Beginner traders in the Forex market should make market entry decisions very carefully. Before the release of important fundamental reports, it is best to stay out of the market to avoid sharp exchange-rate fluctuations.
If you decide to trade during news releases, always place stop-loss orders to minimize losses. Without stop-loss orders, you can quickly lose your entire deposit, especially if you do not apply proper money management and trade with large volumes.
Remember that successful trading requires a clear trading plan, similar to the one outlined above. Making spontaneous trading decisions based solely on the current market situation is inherently a losing strategy for an intraday trader.


