یہ بھی دیکھیں

 24.04.2026 04:03 AM
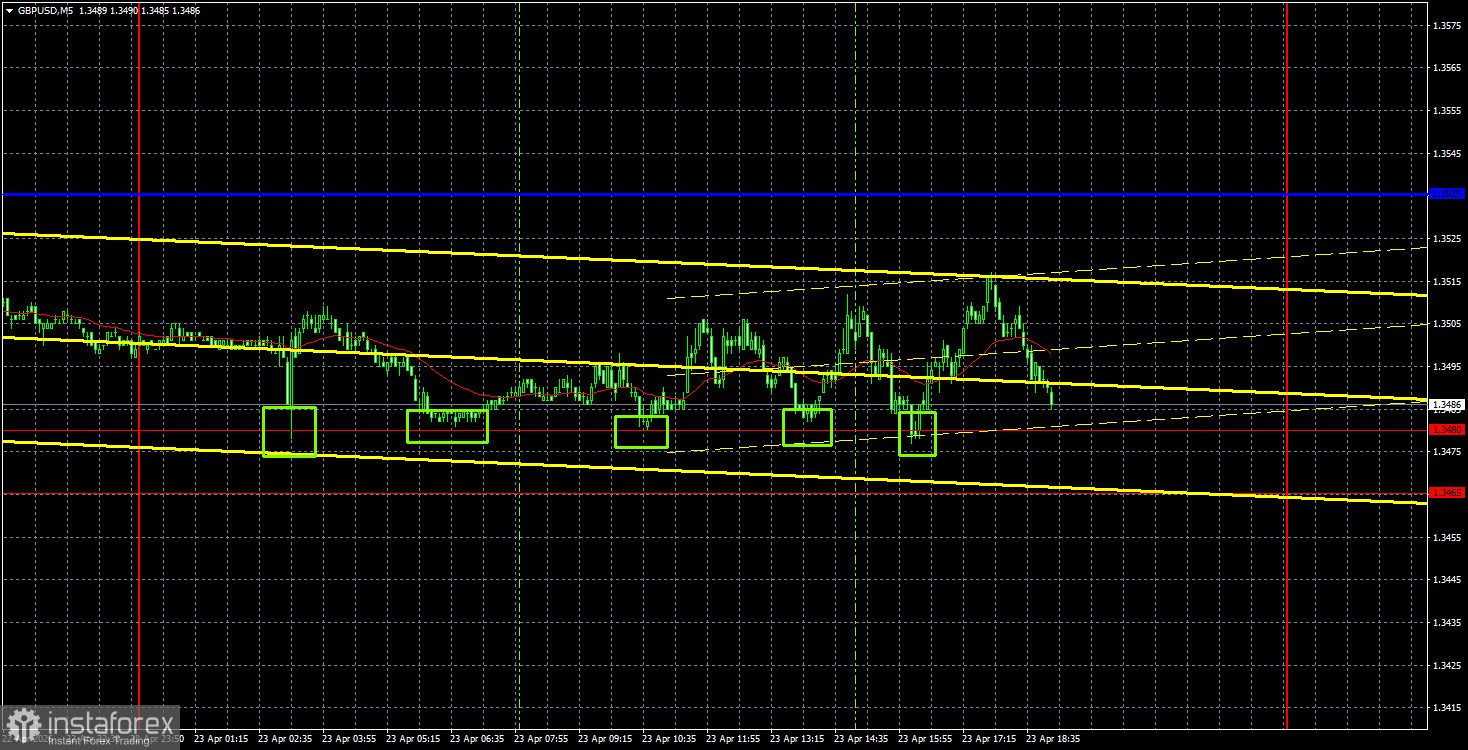
The GBP/USD currency pair traded between 1.3480 and 1.3588 on Thursday, though the channel has narrowed to 1.3480-1.3535. The area between 1.3465 and 1.3480 could not be breached again, so the flat movement remains intact. Yesterday, business activity indices in the services and manufacturing sectors were published in the UK. Although both indices showed higher values than expected, there was no market reaction to this data. This again proves that the market is ignoring the broader macroeconomic backdrop. Earlier in the week, more significant and equally resonant reports on unemployment and inflation in the UK were published, which also did not elicit any response from traders. Thus, the situation remains unchanged, and the British pound continues to struggle to correct meaningfully.
From a technical perspective, the British currency is set for a downward correction but is still trading within a flat range. If the price consolidates below the 1.3465-1.3480 area, the decline will continue toward the Senkou Span B line. Below the Senkou Span B line, we only expect further declines if negotiations between the US and Iran completely fail and war resumes.
On the 5-minute timeframe, five trading signals were formed yesterday for buying. The price bounced off the 1.3480 level five times during the day, and in the best case, it moved up by about 20-25 pips. Consequently, traders could have opened long positions, but they did not yield significant profit or loss.
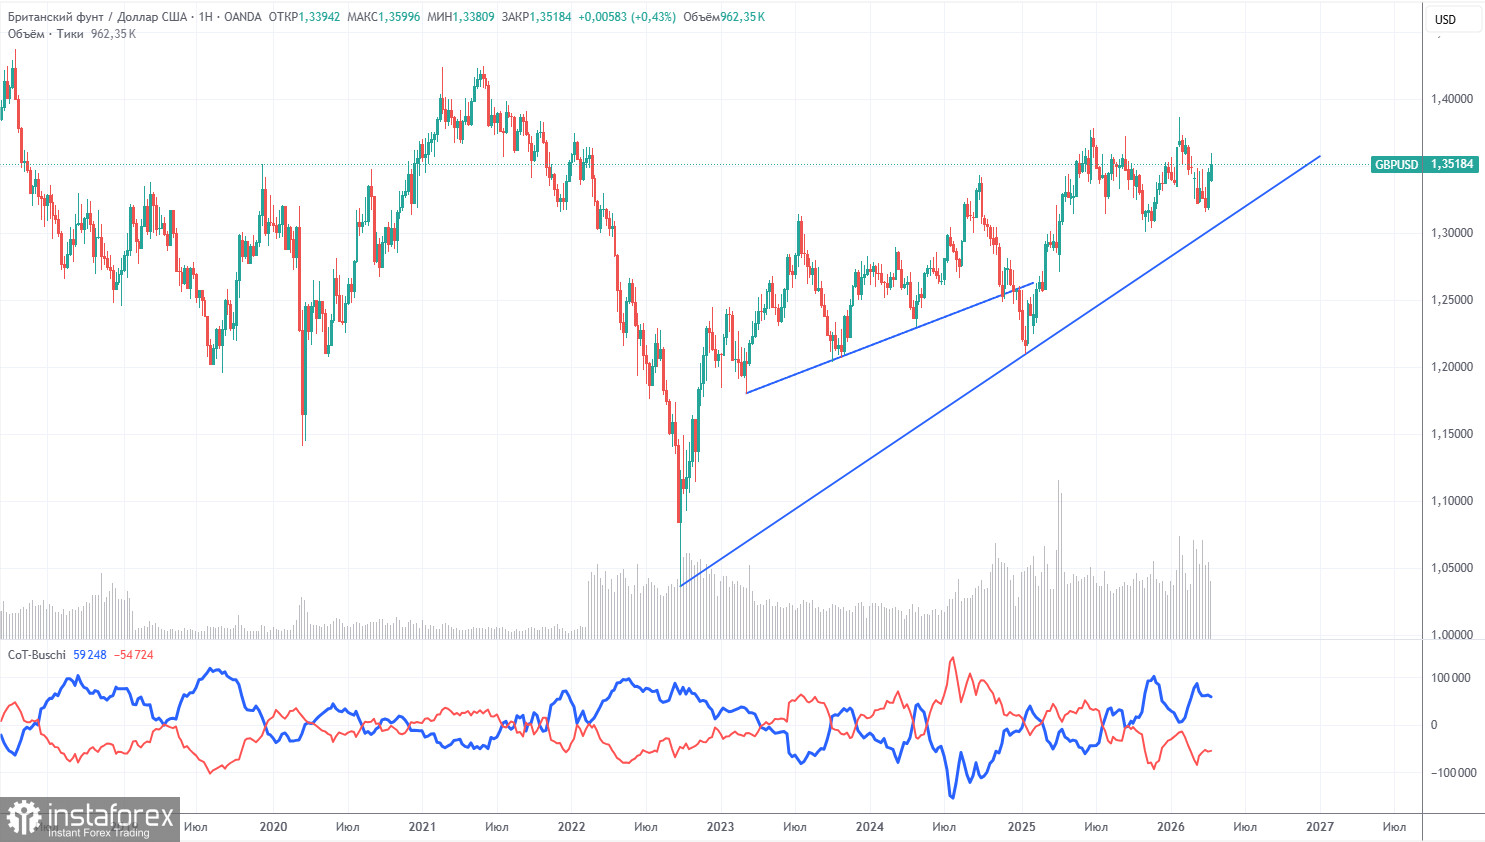
COT reports on the British pound show that traders' sentiment has been constantly changing in recent years. The red and blue lines representing net positions of commercial and non-commercial traders frequently intersect and are usually close to zero. Currently, these lines are moving apart, with non-commercial traders still dominating with their sales. However, given the events in the Middle East, it is no longer surprising that demand for risk currencies is falling while demand for the dollar is rising.
In the long term, the dollar continues to decline due to Donald Trump's policies, as shown on the weekly timeframe. The trade war will continue in one form or another for a long time, and Trump's policies are aimed directly and indirectly at weakening the American currency. However, geopolitical factors currently take precedence, providing strong support for the dollar. According to the latest COT report (from April 14), the "Non-commercial" group opened 7,600 BUY contracts and 5,900 SELL contracts. Thus, the net position of non-commercial traders increased by 1,700 contracts over the week.
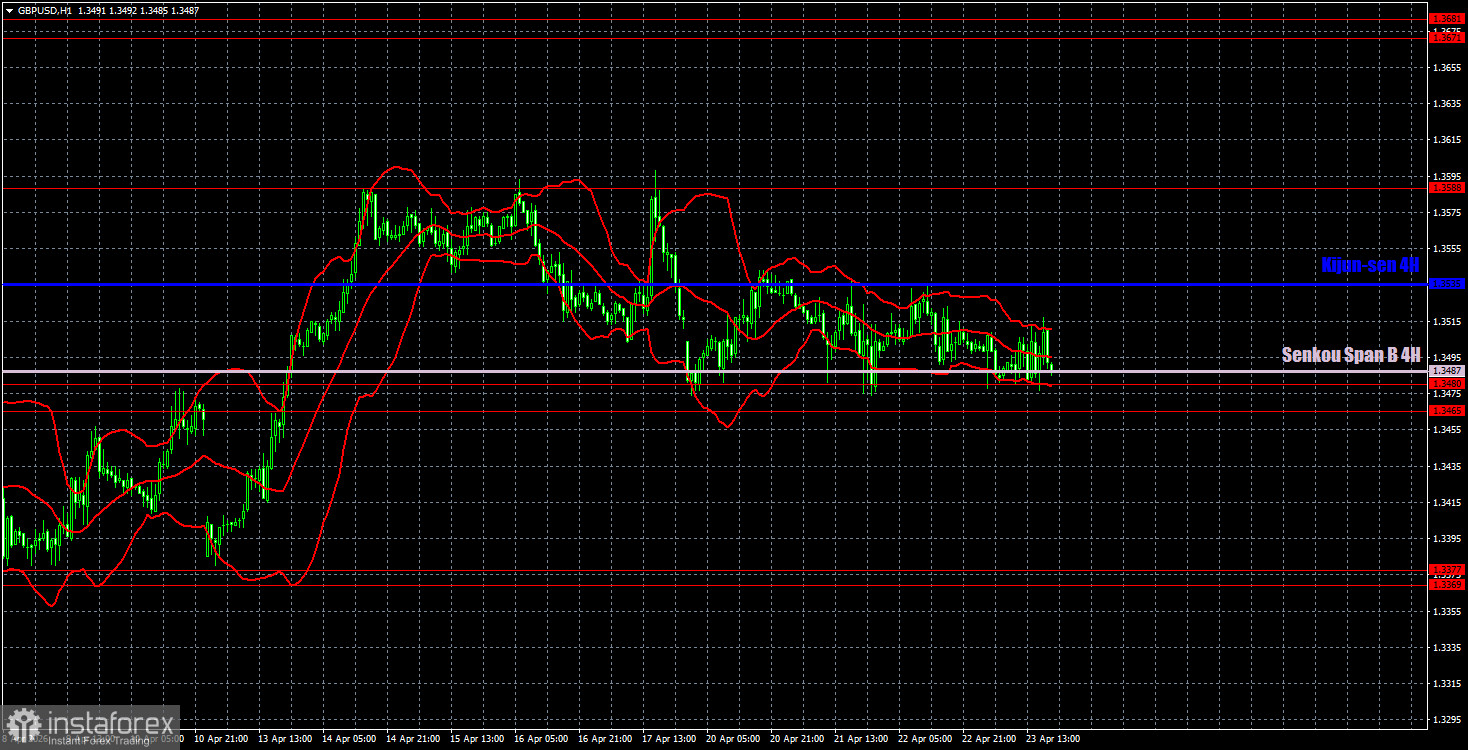
On the hourly timeframe, the GBP/USD pair continues to form an upward trend, but it is only correcting this week. The situation in the Middle East remains tense but has not worsened, so there are few solid reasons for the U.S. dollar to strengthen at this time. This week has been corrective and low-volatility, with the market waiting for truly important events.
For April 24, we highlight the following important trading levels: 1.3096-1.3115, 1.3179-1.3187, 1.3369-1.3377, 1.3465-1.3480, 1.3588, 1.3671-1.3681, 1.3751-1.3763. The Senkou Span B line (1.3487) and the Kijun-sen line (1.3535) may also serve as sources of signals. It is recommended to set the Stop Loss order to breakeven if the price moves in the correct direction by 20 pips. The Ichimoku indicator lines may shift during the day, which should be considered when determining trading signals.
On Friday, the UK retail sales report will be published, and in the US, the University of Michigan consumer sentiment index will be released. However, how likely is it that the market will even notice these reports? Donald Trump has promised that good news on negotiations with Iran will be announced by Friday... Well, we can only wait.
On Friday, traders may consider short positions if the price consolidates below the 1.1657-1.1666 area, targeting 1.1615-1.1625. Long positions can be opened on a bounce off the Senkou Span B line with targets of 1.1750-1.1760.
Price levels of support and resistance – thick red lines, around which the movement may end. They are not sources of trading signals.
Kijun-sen and Senkou Span B lines – lines of the Ichimoku indicator that are carried over to the hourly timeframe from the 4-hour one. They are strong lines.
Extreme levels – thin red lines from which the price has previously bounced. They are sources of trading signals.
Yellow lines – trend lines, trend channels, and any other technical patterns.
Indicator 1 on COT charts – the size of the net position of each category of traders.


