
empty
 
 
23.07.2026 03:35 PM
S&P 500 (SPX): scenario outlook for July 22, 2026

This image is no longer relevant

Despite renewed US–Iran tensions, oil rising to five-week highs, and Houthi threats to block the Red Sea, markets have for now "switched off" geopolitics and refocused on strong corporate results and the incoming tech earnings slate.
This image is no longer relevant

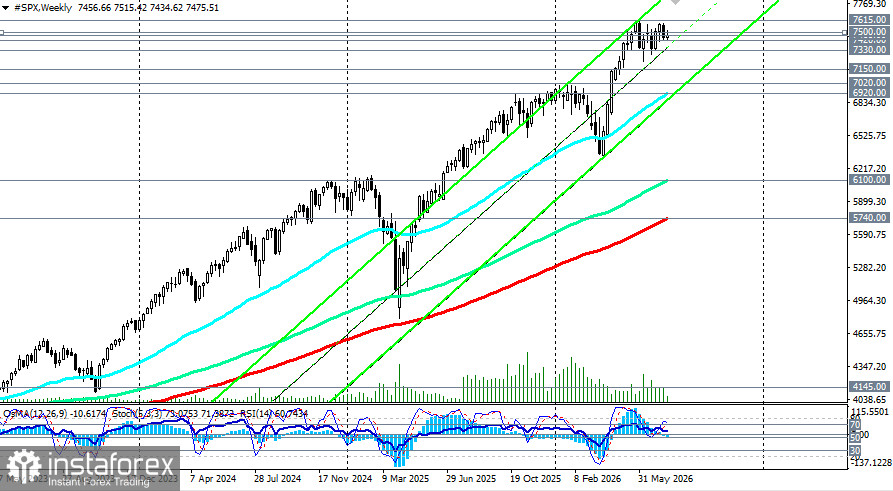
From a technical standpoint, the S&P 500 remains constructive, although indicators give mixed signals:

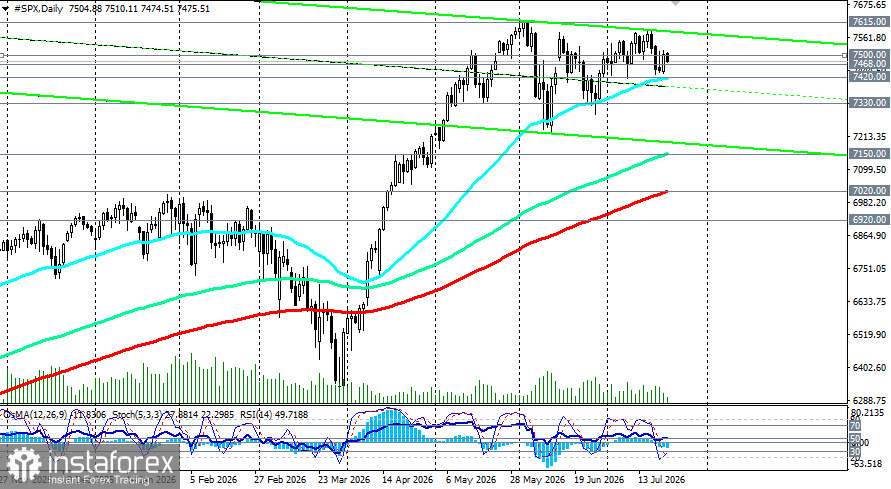
  • The RSI (14) on the daily chart sits around 49–51, indicating neutral momentum.
  • The OsMA remains in negative territory.
  • Stochastic has entered the oversold zone.

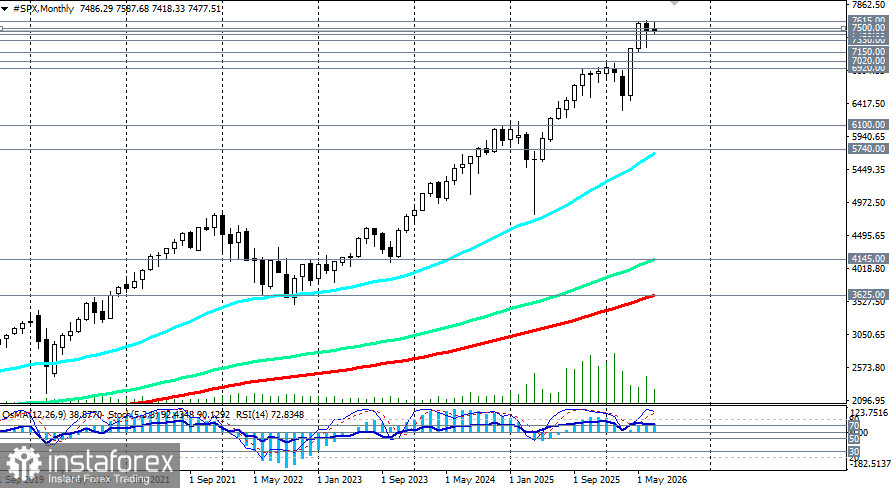
At the same time, after bouncing from the support level of 7,420.00 and the 50-day EMA, the index is trading above the 200-day EMA (7,020.00), confirming the medium-term uptrend.
This image is no longer relevant

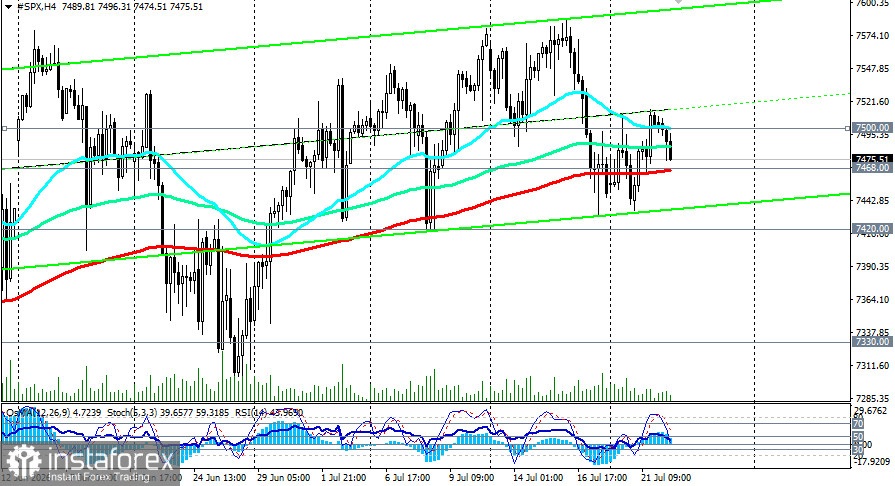
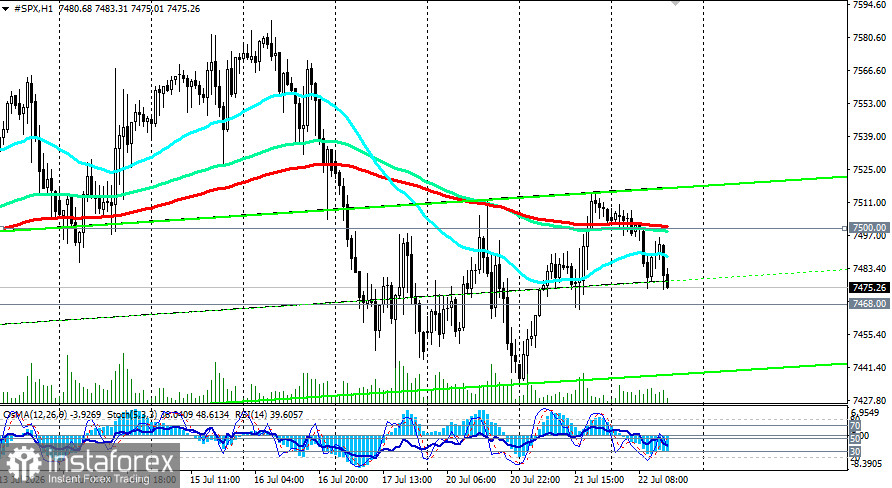
Resistance is located at 7,500.00 (4-hour 50-EMA, 1-hour 200-EMA and a round level) and 7,530.00. A breakout above 7,530.00 with indicator confirmation could open the path to 7,600.00 and 7,700.00.

Conditions

  • Consolidation above 7,530.00–7,550.00 would confirm a resistance breakout and open the way to 7,600.00 and 7,700.00.
  • Strong corporate reports (Alphabet, Tesla) that confirm resilient demand for AI products and services.
  • Easing geopolitical tensions and stabilizing oil prices, which would reduce inflationary expectations.
  • A technical recovery above 7,550.00 with indicator confirmation (RSI above 60, OsMA crossing above zero) would signal a change in momentum.

Immediate support sits at 7,468.00 (200-EMA on the 4-hour chart) – 7,420.00 (50-EMA on the daily chart). Further support levels are 7,400.00 (psychological mark) and 7,330.00 (local support).
This image is no longer relevant

A confirmed break below 7,460.00 would open the way to 7,400.00, leading to an extended decline to 7,300.00 and 7,200.00. Consider pending buy orders in the key zone 7,150.00–7,020.00 (144- and 200-period EMAs on the daily chart) to enter the market at more attractive levels: the global bullish trend of the S&P 500 remains intact.

Conditions for the bullish scenario

  • Consolidation above 7,550.00 will confirm the resistance breakout and open the path to 7,600.00 and 7,700.00.
  • Strong corporate reports (Alphabet, Tesla) confirming robust demand for AI products and services.
  • Easing geopolitical tensions and stabilizing oil prices, which would reduce inflation expectations.
  • A technical recovery above 7,550.00 with indicator confirmation (RSI above 60, OsMA crossing above zero) would signal a momentum shift.

Main scenario (base case for 1–2 weeks)

Most likely dynamic — volatile consolidation in the 7,420.00–7,550.00 range with an attempt to break higher if corporate results are strong and geopolitical risks ease.
This image is no longer relevant

Rationale

  • Uncertainty around earnings and geopolitics creates elevated volatility. Markets will wait for signals from both drivers to determine the next leg.
  • The technical picture supports a maintained uptrend (price above EMAs), but neutral oscillator readings and approaching the 7,550.00 resistance level suggest consolidation is probable.

Recommendation — cautious

Prioritize long positions on a confirmed break above 7,550.00. Short positions are appropriate only on a confirmed break below 7,460.00 and supported by fundamental factors.

Trading scenarios

  • Bullish scenario: Buy Stop at 7,520.00, 7,540.00, 7,560.00. Stop-loss: 7,460.00, 7,450.00. Targets: 7,600.00, 7,700.00, 7,800.00, 7,900.00, 8,000.00.
  • Bearish scenario: Sell Stop at 7,460.00, 7,450.00. Stop-loss: 7,510.00, 7,520.00. Targets: 7,420.00, 7,400.00, 7,330.00, 7,300.00, 7,250.00, 7,200.00, 7,150.00, 7,100.00, 7,020.00, 7,000.00, 6,920.00, 6,900.00, 6,870.00, 6,800.00.

Note: "Targets" correspond to support/resistance levels. They are not guaranteed to be reached but can serve as reference points for planning and order placement.

Recommended Stories

ابھی فوری بات نہیں کرسکتے ؟
اپنا سوال پوچھیں بذریعہ چیٹ.